Ultimate Guide to Deep Source Stepping Into [almost] Anything [in Visual Studio]
Sometimes our code doesn't work (no seriously, it happens). We debug and step through, all looks well, at some point it enters into some method we don't control -maybe part of the core framework- and BOOM an exception. Or maybe the data just comes out the other end all ugly and wrong.
In this post you'll find out exactly how to step right in to this 'foreign source code', breakpoints and all. I've used these techniques just in the last few weeks to peak into Xamarin inner workings as well as figure out why the openIdConnect library was periodically refusing to validate my tokens. Once you can do this, it's a tool you'll never want to live without.
Of course the .Net Framework and many, many of the libraries we use are open source, but this does not automatically make it easy to debug into them. To compile the source ourselves for debugging, even in the easiest scenario we have to clone the repo, find the build script, change our project, and hope.
Things rarely go that easily. Often git repos aren't tagged with releases so you don't which revision to grab. You may have a reference hierarchy relying on strong naming, and while you may have source, you certainly don't have signing keys. And of course if you're not sure what's going on, you may have several different libraries you need to build and integrate and walk through and that can be extremely time-consuming.
Many of you will know that Visual Studio has long had Enable Source Server Support option and Enable .Net Framework source stepping but those never quite seemed to work the way we wanted. If we add the source servers from http://SymbolSource.org we get a bit more help. They maintain their own servers with debugging symbols (often with source code), and include many of the instructions necessary to get things working (all of which are included in my complete instructions below). While this helped, it wasn't complete.
A few of you may even know that Visual Studio has added Enable Source Link Support which will be a whole lot better and easier to use than the Enable Source Server option, but until the whole world including all of our legacy version references support it, we're going to need a blended approach, and even with source link, some of the steps you'll find below can be required. A lot more information on "Source Link" here: https://github.com/dotnet/designs/blob/master/accepted/diagnostics/source-link.md.
The Source Link and Source Server options are, unfortunately, mutually exclusive - or at least they are in practice - you can check both but the Source Server option will take precedence. This means that part of the ultimate solution is to toggle the options and see what works best with the symbols you have available to you.
Source LinkandSource Server(as well as other helpful debug info) rely on something called "debug symbols". What are those? When a module is compiled for release, it's generally made as small and performant as possible, meaning a lot of information is omitted -- information that would be helpful in troubleshooting and debugging. Things like variable and method names, and how to correlate an executing instruction to a line in a source file. That information, which we refer to as "debug symbols" is omitted from the compiled module itself, but can be included in a separate file that usually has the extension.pdb. Sometimes the 'pdb' files are distributed with the module and sometimes we can find them from well known locations called "Symbol Servers" (as discussed below)
The final complexity we have to address is that if we want to step into framework and release libraries, we'll often be dealing "Compiler optimizations". That means that what is loaded into memory and executing does not match the code that existed when the library was compiled and the .pdb (debugging symbols) was generated. The compiler optimizations are allowed to change the code itself, as long as they don't change the symantics - that is, as long as they don't change how the program behaves to an outside observer. To put it yet another way: for given inputs, the outputs and side-effects are not changed. These optimizations can make step-through and breakpoints partially work for a given module: some breakpoints being hit, others being ignored. It's quite frustrating.
Compiler optimizations can take two forms:
1. JIT'ing: In other words the assembly is compiled to CIL (.Net's meta-language) and is CIL on disk but as the code was loaded into memory, it was compiled to native with optimizations turned on. To avoid this, we simply need enable the Debugging option Suppress JIT optimization on module Load.
2. The other form is when an assembly was compiled to native image on disk (the author would have done this with NGEN.exe for performance reasons [using NGEN yourself is outside the scope of this article]). The solution to this is a bit more awkward: you have to instruct your system to always look for a regular 'CIL' version of the assembly and prefer that to the native image. You can do this by having an environment variable set while launching Visual Studio. Since you really don't want this option on all the time, you'll probably want to launch VS from a command line. The environment variable is set COMPLUS_ZapDisable=1. (In fact, there are other ways around this too, check out this link for more: https://github.com/Microsoft/dotnet/blob/master/Documentation/testing-with-ryujit.md).
The Step by Step
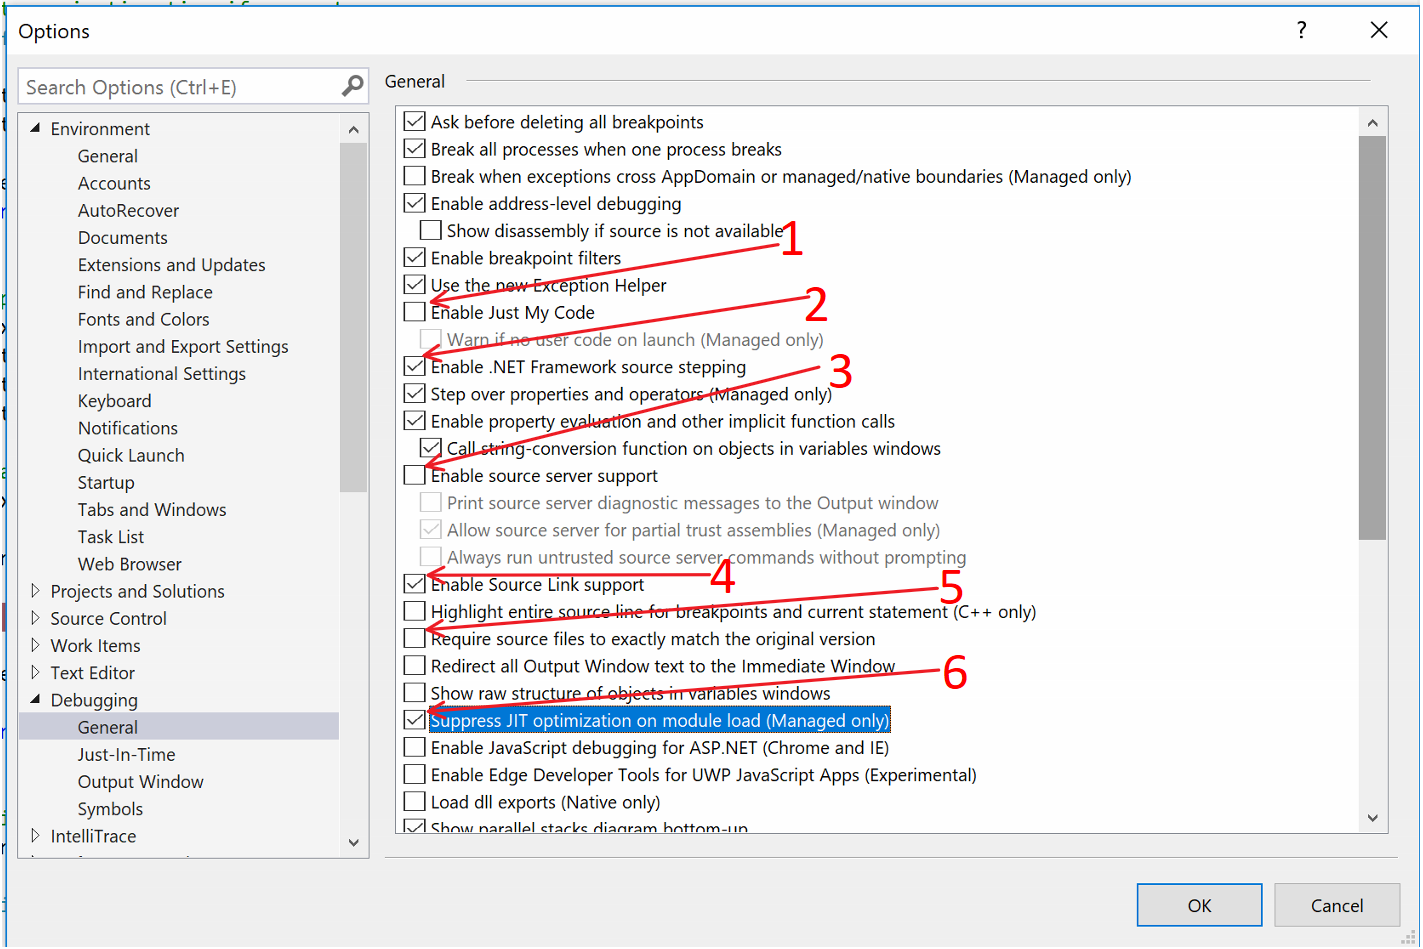
1. Set up your debugging options##

Ok, first the easy ones
Enable Just My Code- OFF - This one should be obvious.Require source files to exactly match the original version- OFF - This doesn't really seem to help much you still need a perfect match for your .pdb -- you'll rarely have the exact matching .pdb but have it pointing at not-quite-matching source files -- but turn it off anyway.
It would be super if we could go through all those options one-by-one, but there are some complex interdependencies as we discussed above. So you may need to try some different combinations.
Let's start by trying the "New Hotness" way
2. Enable .Net Framework Source Stepping - ON - More on this one later, but we'll try "on" first.
3. Enable Source Server Support - OFF - To quote Will Smith, this is the "old and busted". It's not really busted, just less ideal, so we're going to try this one later.
4. Enable Source Link Support - ON - Agent J in a new suit - See above for more discussion on this and a link to the real deep stuff.
6. Suppress JIT optimization on Module Load - OFF - Turn this bad boy off so we can breakdance and get stepping. I mean hit breakpoint and step through the source.
We're going to go with these options to start. Let's move on to the other steps.
2. Set Symbol Servers
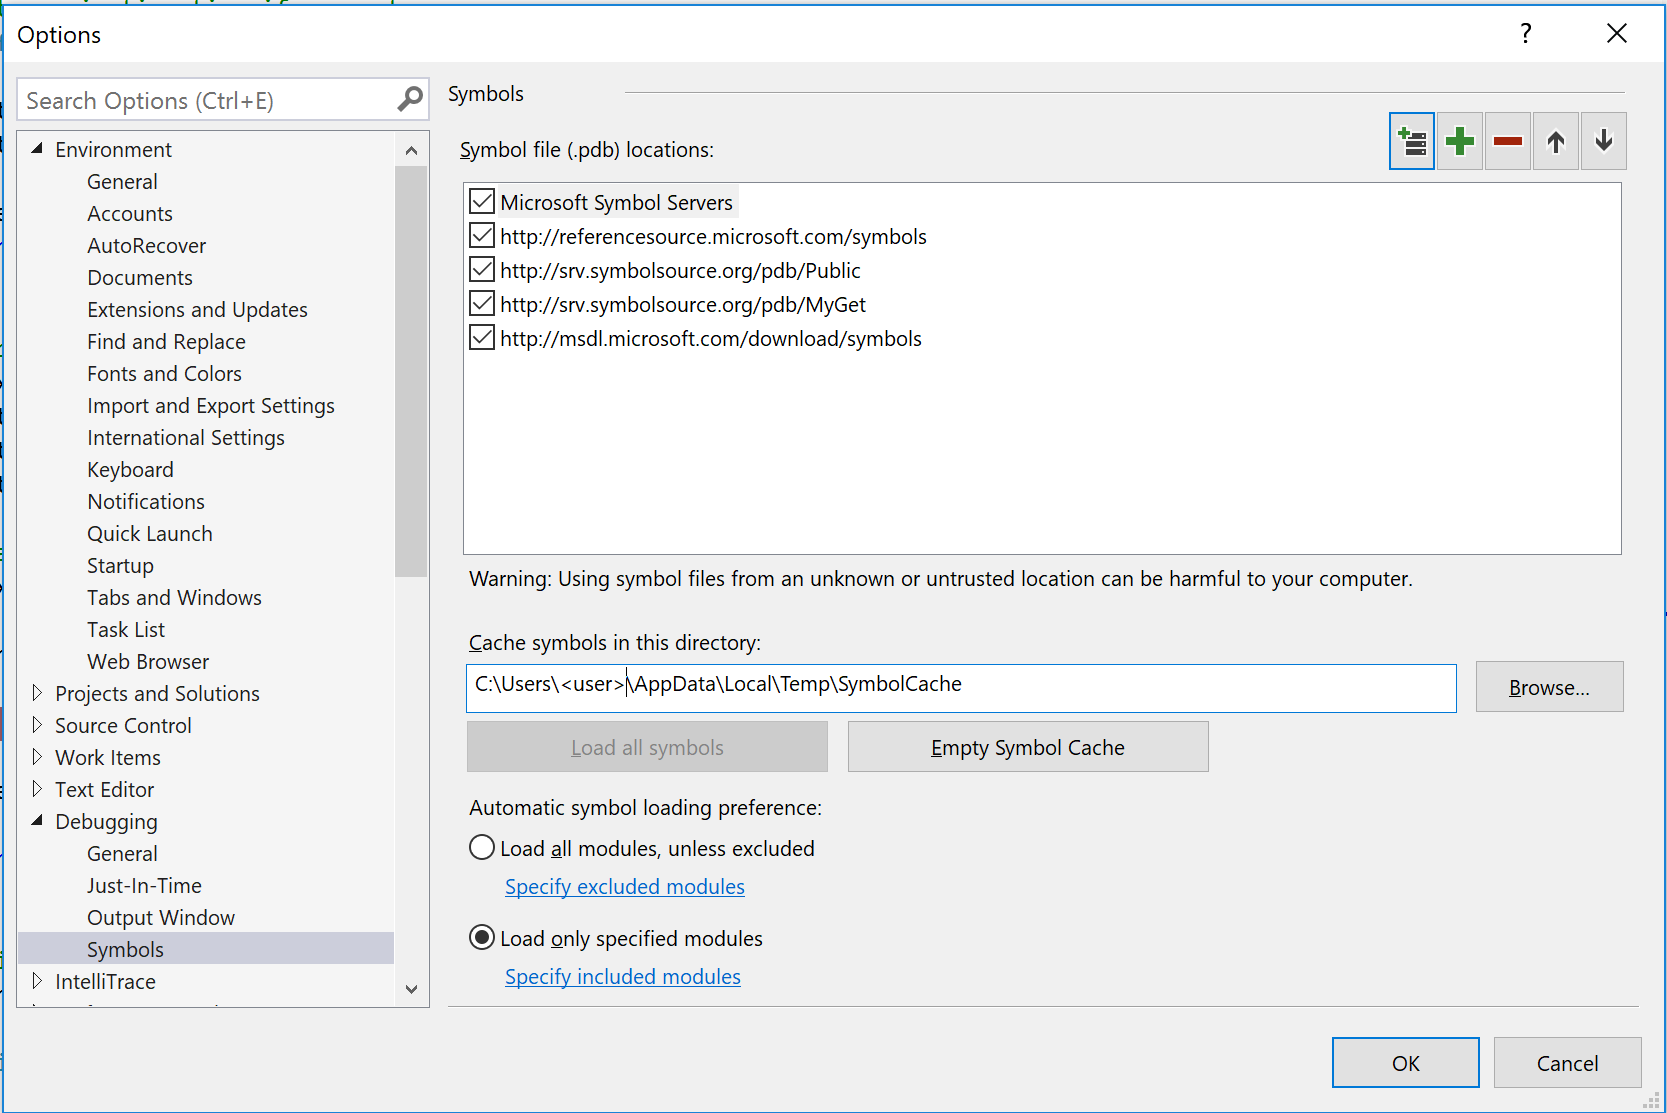
While you're in that options window let's go down to the Debugging > Symbols window.

Under symbol file locations copy the values in the screenshot. Under Automatic Symbol Loading Preference, you can select "all" but it will take a looooooooong time to launch any debugging sessions. We'll address how to handle them individually later. So for now you should probably select Load Only Specified Modules. Don't worry about specifying them yet.
3. Launch Visual Studio in a Special Way
This step may actually be optional. If you can debug into everything you need to debug into without it, well, my friend, good for you.
As discussed above there are a few ways to handle this environment variable, but we're going to go with the temporary, easy way. Fire up a command prompt (if you need visual studio to launch with Administator privileges then your command prompt should be launched with Administrator privileges). Enter the following:
    set COMPLUS_ZapDisable=1
    cd /d "%ProgramFiles(X86)%\Microsoft Visual Studio\2017\Enterprise\Common7\IDE\"
    start devenv.exe
If that path doesn't match your path, adjust appropriately.
4. Load Symbols
The first thing you need to understand is you will not be able just "Go To Definition" and get into some source. (Though that is a sorely needed feature). To get into the foreign source we're going to first need to set a breakpoint in our own code. So go do that. Then start debugging.
Once you are on a breakpoint, it's time load the foreign symbols. You have two options for this:
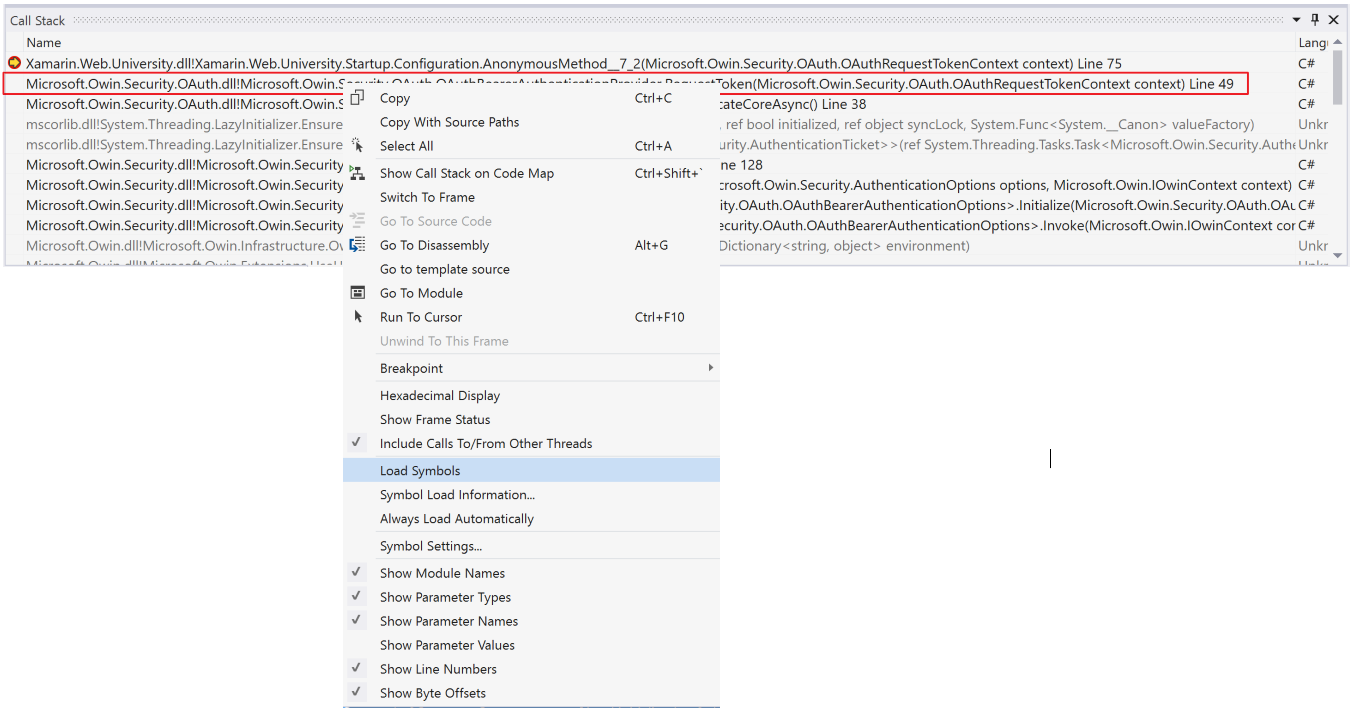
- If you are lucky enough to be able to put your breakpoint in a spot where the foreign library is in the call stack (like in a callback), then you can go to your call stack window (Ctrl+Alt+C), right click on the line with the foreign module and select "Load Symbols" or "Always Load Automatically". The latter will put this module in the list that will be fetched pro-actively every time you debug from here on out.

- The other option still requires you to be on a breakpoint, but that's all. Go to your Modules window (no hotkey, Debug->Windows->Modules). Once again you can right click and select "Load Symbols" or "Always Load Automatically".
Annnnd hopefully that's it for loading symbols. If they are available in any of the servers listed above all is well and it will show in the Call Stack or Modules Window that symbols are loaded.
If not, it will prompt you to find them. If they aren't available from any of those servers you may get lucky and they included in the nuget package (Xamarin.Forms does this, for example), so check your nuget various nuget caches, find the assembly, and see if it has a .pdb with it (the .pdb is the symbol file you want).
Common Nuget Locations
- If there is a
Packagesfolder as a sibling of your .sln file - %userprofile%.nuget\packages
If this doesn't work, you may need to try the other option Enable Source Server Support - jump to Step 6, you won't need to tweak much. Or, if you just can't find a .pdb you may need to contact the author of the module (Microsoft put out .pdb's for pretty much everything it publishes).
5. Debug!
If the module you want to debug is in the call stack you can right click the module you want source for, now that the symbols are loaded a new option may appear: Go To Source Code.
Alternatively you can Step through your code until you get to a line in your own code that calls in to the foreign module. If you Step Into (F11), it should bring you to the source for the foreign module!!!
Not working? Symbols loaded but can't find the source file? No problem, our alternative technique from Step 6 might still work! Alternatively, when it prompts you for where the source file is, if you've got the source, browse to it yourself!
At this point, you can keep stepping, add breakpoints, go nuts! The breakpoints will last through restarting the debug session just like all your other breakpoints, and if you chose to "Always Load Symbols" for this module, it will all just automatically work the next time your start debugging this project!
6. It didn't work?
Ok, it's cool, we have a couple tricks up our sleeve. As of this writing, a lot of existing stuff is still going to require the "old way". So let's go back to our Options dialog: Debugging->General

Change 3. to ON and 4. to OFF.
You may want to restart Visual Studio (using the technique described in Step 3), but this might not be necessary.
Try loading symbols and stepping through again (Steps 4 & 5).
Still no? We're getting desperate here now. The last thing to try is turning 2. Enable .NET Framwork Source Stepping to OFF. That setting doesn't seem to cause any problems, but some documentation on SymbolSource.org indicates that once upon a time it did. So hey, give it a shot.
If you still aren't up and running it could be that there are no symbols available with source code information. That's rare with Microsoft assemblies, but certainly happens with third party components. And that's why there is "Almost" in the title of this blog post :(